

Last year, I sat down with a SaaS founder who was struggling to figure out how to find ICP for their business. His team was working around the clock. They were chasing every lead. Their sales deck looked perfect. But their growth? Flat as a pancake. "We just need more leads," he told me. But that wasn't the real problem. After digging into their data, we found something interesting. 80% of their revenue came from just one specific type of customer. Even better – these customers rarely churned and usually upgraded within six months. This research changed everything. Within three months of focusing only on similar customers:
- Their sales cycle dropped from 45 days to 18 days
- Customer acquisition costs fell by 40%
- Trial-to-paid conversion doubled
The secret to finding the perfect customer isn't casting a wider net. It's knowing exactly who to fish for.

By 2025, 75% of companies will “break up” with poor-fit customers, according to Gartner. So in this guide, I'll show you why the traditional Ideal Customer Profile (ICP) approach is not right, the three pillars of ICP, and how to find your ideal customers with practical steps that worked for many of my clients. Let’s get started.
What is ICP?
An Ideal Customer Profile goes beyond basic target audience definitions. It's about identifying who your right customer is based on specific parameters. These parameters could include their budget capacity, the actual need for your solution, and criteria like revenue or employee size. As Gartner states “The ideal customer profile (ICP) defines the firmographic, environmental, and behavioral attributes of accounts that are expected to become a company’s most valuable customers.”
But more importantly, it's about understanding who will get the most value from your offering and be profitable for your business. According to a study by HubSpot, companies with a well-defined ICP are 50% more likely to acquire new customers.
How to Build a SaaS ICP: Quick Takeaway
Use these insights to build an SaaS ICP and an Anti-ICP that sharpen your marketing, sales, and product strategy.
Why Traditional ICP Approaches Fall Short
Take a look at most Ideal Customer Profiles (ICPs): "B2B companies, 100+ employees, $10M+ revenue, in the tech sector." These surface-level descriptors are just the tip of the iceberg. In my years helping SaaS companies, I've noticed something crucial: The most successful organizations don't just categorize customers by basic demographics. They dive deeper, obsessing over how their customers actually behave and operate. Traditional ICPs trap you in a misleading world of surface-level metrics:
- Counting employees
- Tracking revenue
- Filtering by industry
These metrics create a false sense of understanding. They ignore the nuanced realities of customer success. What Truly Defines an Ideal Customer:
- The critical challenges disrupting their business
- The intensity of their solution-seeking urgency
- Their strategic decision-making framework
- Potential for successful product integration and adoption
Think about your best customer right now. They're not great because they fit a perfect demographic profile. They're great because your solution fits perfectly into their world.
The Three Pillars of an Effective SaaS ICP
Organizations with a strong ideal customer profile achieve 68% higher account win rates than their competitors, according to Hubspot. These three pillars will help you identify real opportunities and avoid costly missteps. Trust me – I've seen companies double their growth by getting these right.
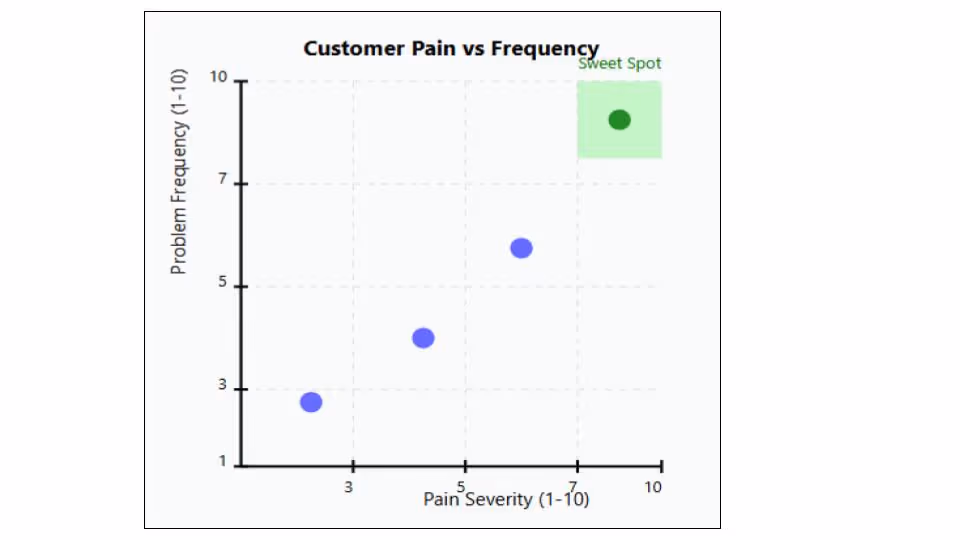
1. Pain Intensity Matrix
Let's start with a simple exercise I do with every SaaS founder. Take your last 10 customers and plot them on two axes:
- X-axis: How bad is their pain? (1-10)
- Y-axis: How often do they feel it? (1-10)
For example, let’s consider a project management tool. Let’s try to map their ICP.
- High pain (8/10), High frequency (9/10): Team missing deadlines daily
- Low pain (3/10), Low frequency (2/10): Occasional task delegation issues
Your sweet spot? That top-right corner where problems are both serious and frequent. Companies targeting high pain (8+) and high frequency (8+) see:
- Faster sales cycles
- Higher average contract value
- Better retention rates
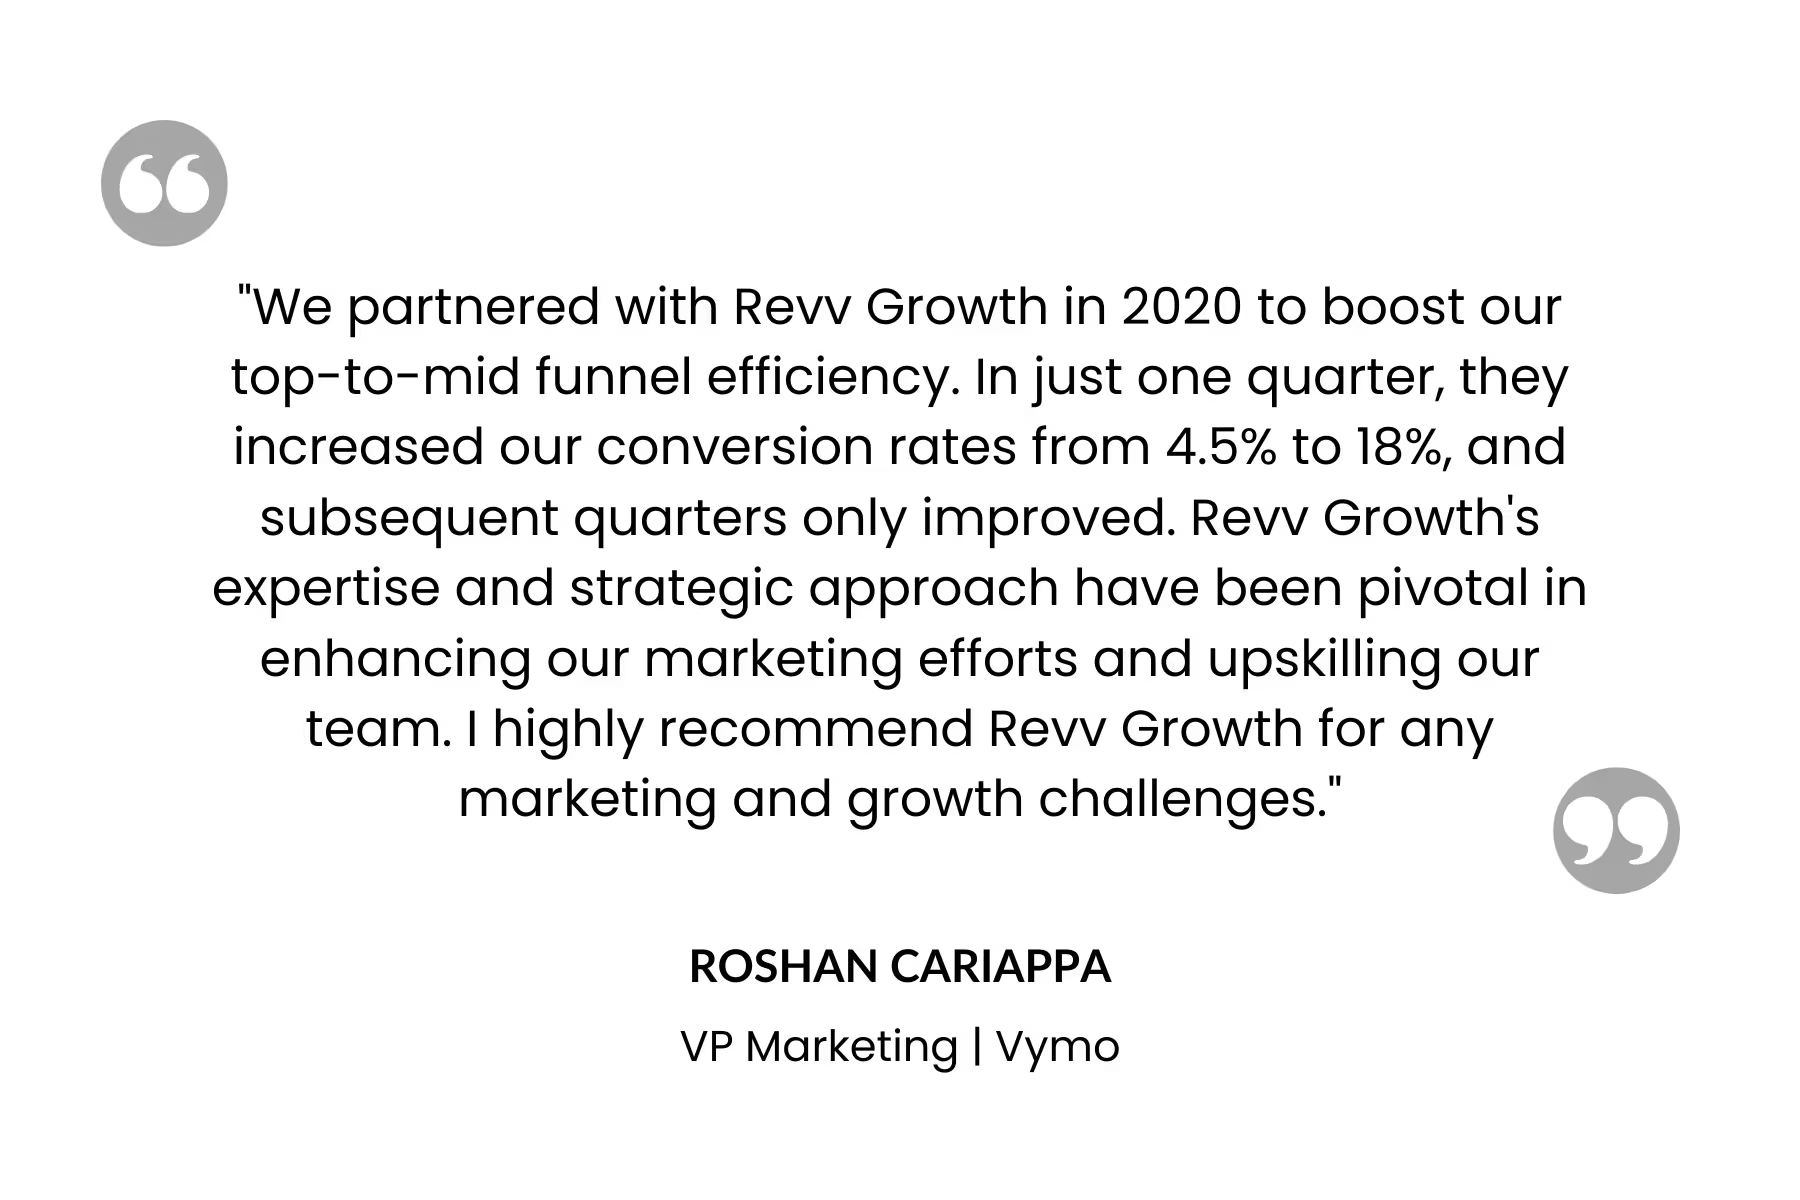
When we started working with Vymo, they struggled with a 4.5% MQL to SQL conversion rate. By implementing the pain intensity matrix, we identified their ideal customers as financial institutions experiencing daily sales tracking challenges (Pain Severity: 9/10) with constant manual data entry issues (Frequency: 9/10). Focusing on this precise pain point, we helped them increase their conversion rate to 18% and generated a $41.5M marketing-sourced pipeline.
2. Operational Readiness Indicators
Another important pillar is the operation readiness indicator. Stop asking "Can they pay?" Start asking "Can they succeed?" Here's your operational readiness checklist:
- Technical Infrastructure demands a holistic approach. Ensure your technology stack is fully compatible, with API integrations that meet all critical requirements. Comprehensive data availability is the cornerstone of seamless implementation.
- Internal Champion selection is pivotal. Identify a key stakeholder with decisive power, budget authority, and significant team influence. This individual bridges strategic vision with practical execution, driving organizational alignment.
- Implementation Resources transform strategy into reality. Assemble a dedicated team with a clear, structured timeline and an unwavering commitment to comprehensive training. These resources translate potential into tangible success.
SoluteLabs, a product engineering firm previously relying solely on referrals, exemplifies the framework's effectiveness. By implementing the operational readiness framework SoluteLabs achieved remarkable growth through enhanced lead qualification while reducing implementation time by 60%.
3. Value Realization Timeline
The speed at which customers experience their first meaningful success with your product directly impacts conversion rates and long-term retention. Our data shows ideal timelines by product type:
- Simple tools: 1-7 days
- Mid-complexity solutions: 14-30 days
- Enterprise platforms: 30-90 days
Key warning indicators include implementation periods extending twice beyond standard timelines, unexpected training extensions, and suboptimal early adoption metrics. These signals often predict reduced customer satisfaction and higher churn risk. When Docsumo approached us, their conversion rate was stuck at 0.7%. By aligning their product demonstrations and trial period with customer value realization timelines, we helped them:
- Increase conversion rate to 2.5%
- Double their opportunities
- Achieve faster implementation success
- Create stronger customer relationships
This approach has consistently delivered results across our client base. Whether it's Vymo's 4x increase in conversion rates or LeadSquared's 40% boost in bookings, these pillars form the foundation of successful ICP strategies.
How to Find Your SaaS ICP (A Data-Driven Approach)
According to Sales Insights Lab, 50% of your prospects are unlikely to be a good fit for what you sell." For years we tracked vanity metrics, chasing prestigious company names rather than analyzing meaningful patterns," reflected the CEO of a company during a recent consultation. If you are also doing that, then it is time to stop. Let's fix it. Here's your playbook for finding your true Ideal B2B Customer Profile (ICP).
1. Analyze Existing Customers
The first step in building your ICP is analyzing your existing customers, specifically your top 20%. These accounts reveal the strongest product-market fit, highest revenue retention, and best adoption patterns.
- Lifetime Value (LTV): Focus on customers who generate 3x or more than your median LTV, as these companies demonstrate strong product-market fit and long-term partnership potential. Their spending patterns often reveal untapped opportunities across your customer base.
- Net Revenue Retention (NRR): While 100% indicates stable revenue, your ideal customers should achieve 120%+ through organic growth and expanded usage. These customers naturally discover new use cases and value in your product over time.
- Product Usage Depth: Look for customers who rapidly adopt your core features within the first 60 days. High daily active users relative to licensed seats indicate strong product embedding within their operations and clear value recognition.
- Expansion Revenue: Your best-fit customers typically grow their investment by 40% annually, regularly discovering new ways to leverage your solution across their organization. They proactively seek opportunities to derive more value from your product.
- Implementation Success: Ideal customers complete implementation on schedule and achieve their defined success metrics within 90 days. Their smooth onboarding often indicates strong organizational alignment and clear use cases.
2. Gather Qualitative Insights
Numbers tell part of the story, but behavior, context, and decision-making patterns are equally important. Once you’ve identified your top performers, the next step is gathering qualitative insights to uncover why they succeed. This means studying their purchase journey, integration needs, feature adoption, support evolution, and expansion signals.
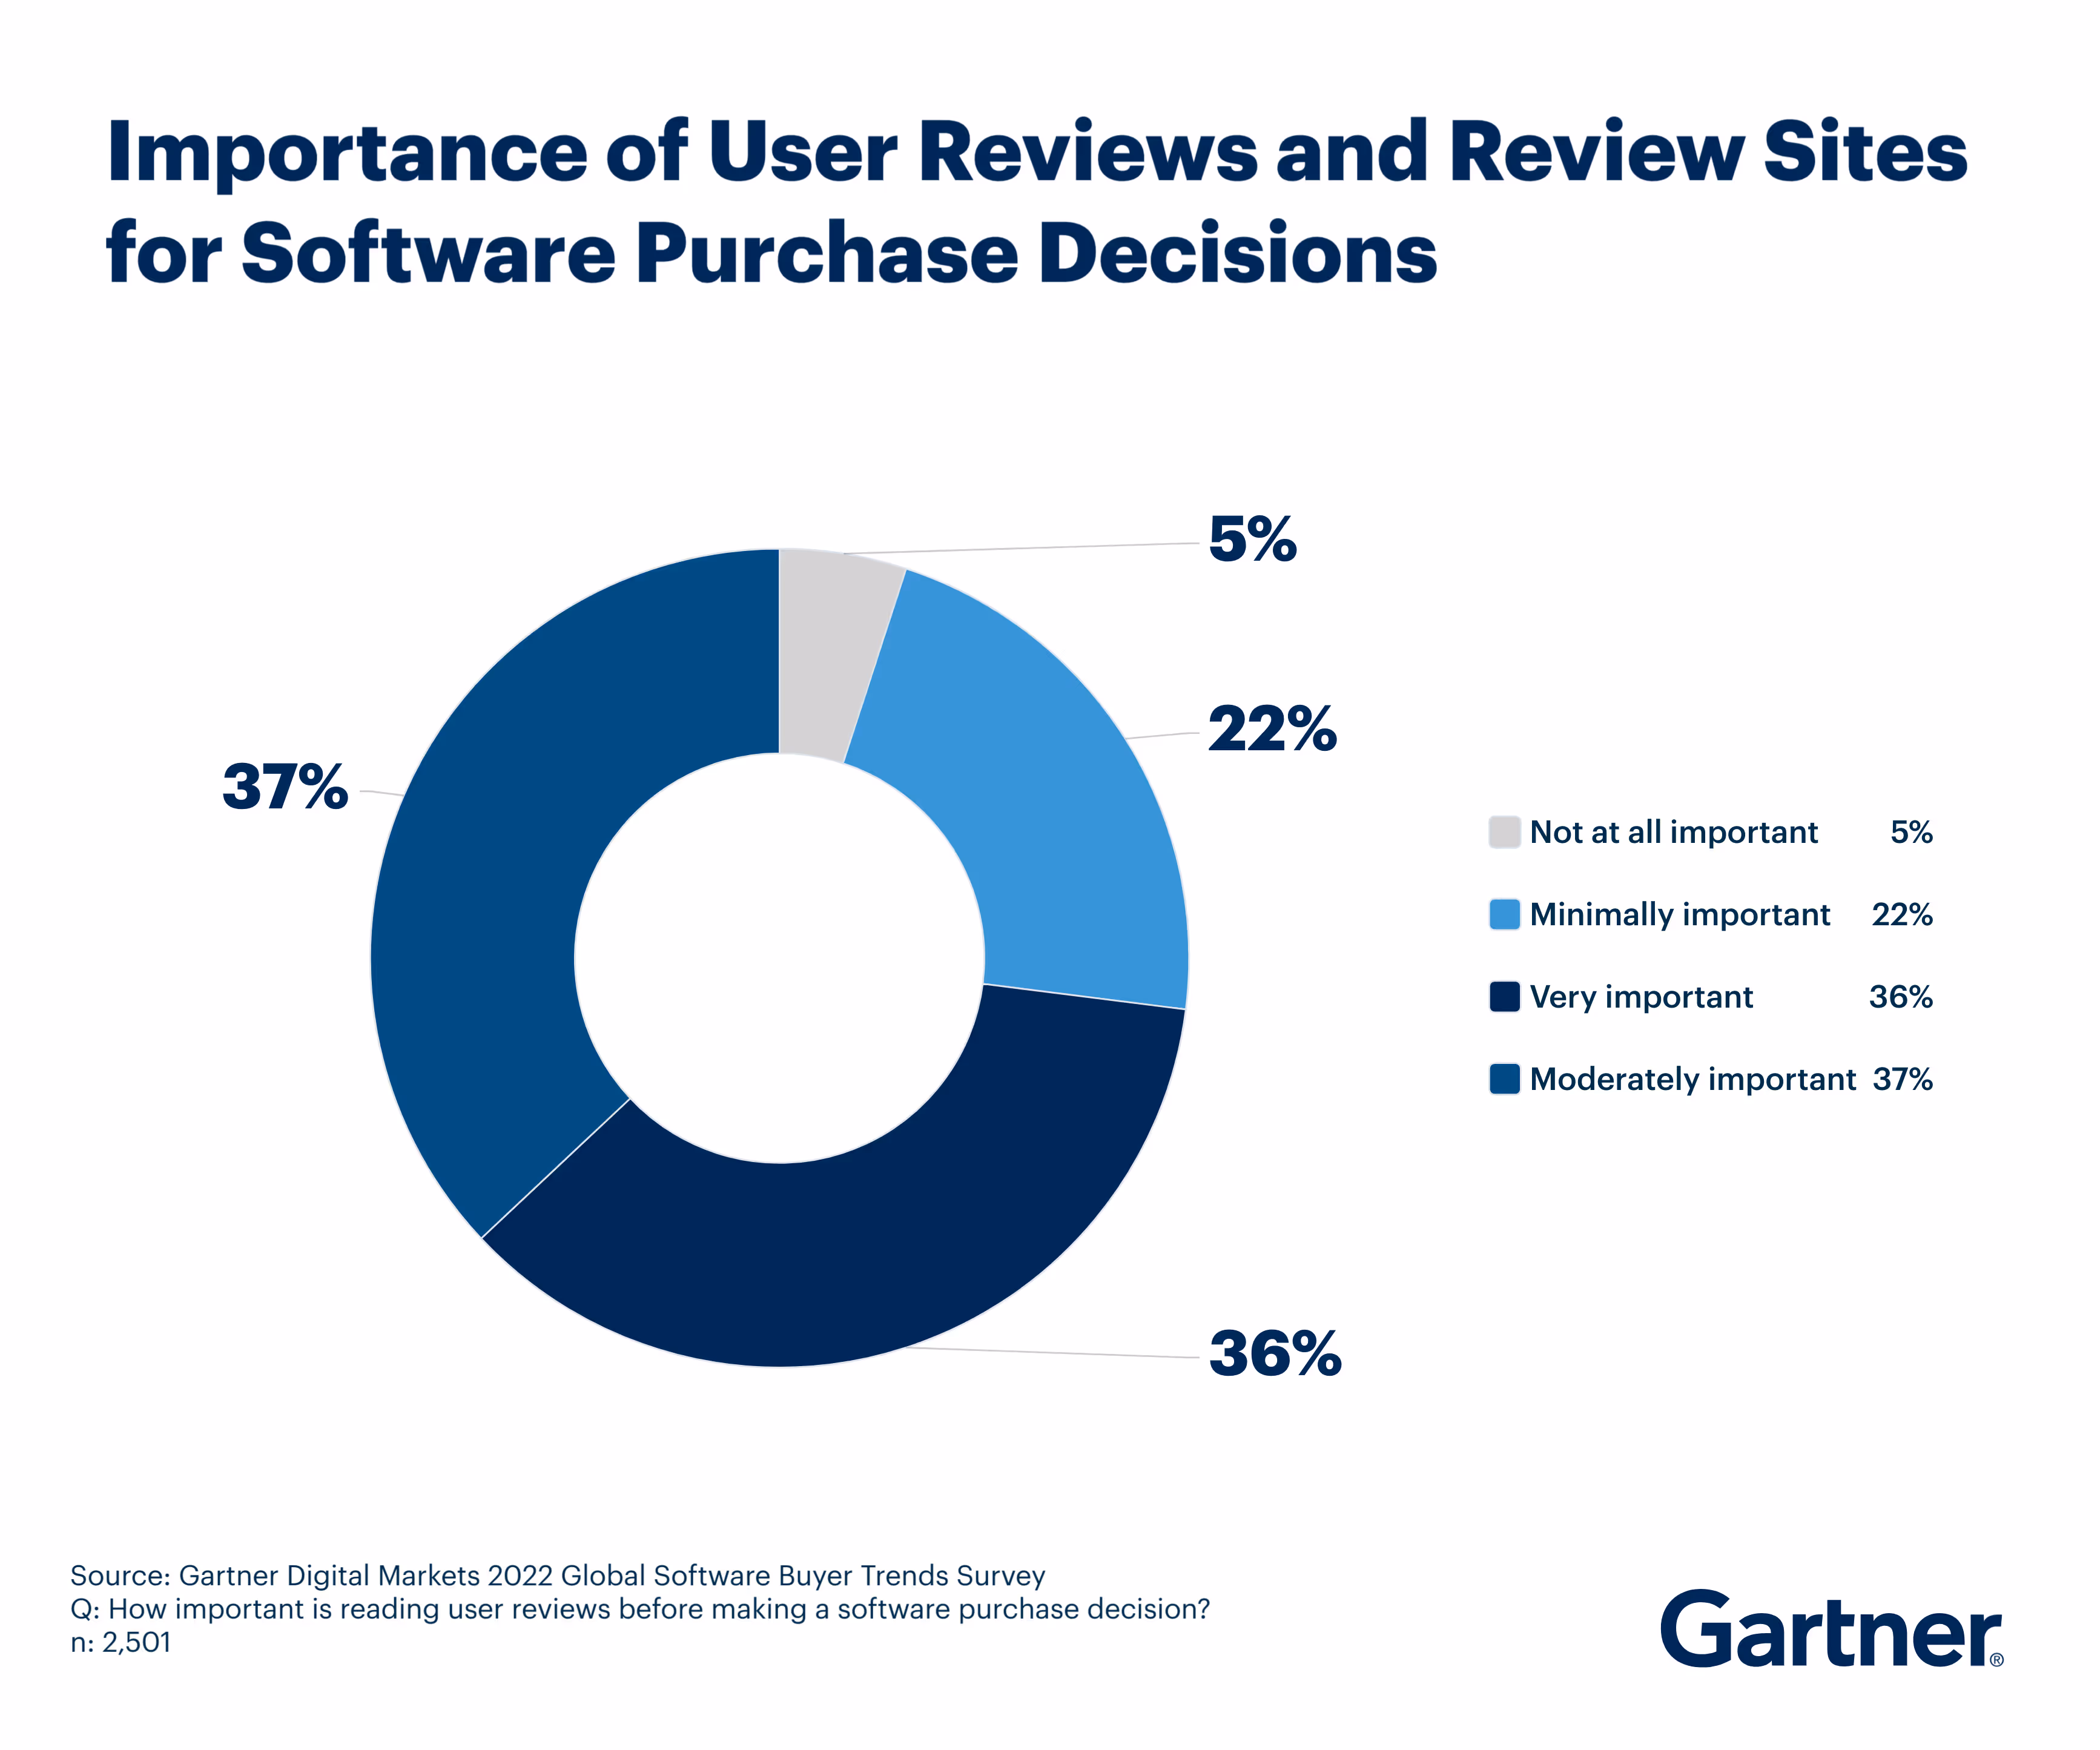
- Purchase Decision Process: According to Gartner, 66% of buyers say reviews significantly influence their purchase decisions, with 85% trusting them as much as personal recommendations.
Additionally, 71% prioritize reviews from the past six months. Identifying prospects who actively engage with review sites can reveal patterns in your ideal customer profile, helping you tailor strategies to convert more prospects effectively.
- Integration Requirements: Jason Lemkin, the founder of Saatr points out that "Customers needing minimal customization stay longest." Look for those who use standard APIs, rely on out-of-the-box integrations, and handle clean data migration with minimal custom fields.
- Feature Utilization: A benchmarking survey found that users engage with only 6.4% of product features on average, meaning that for every 100 features developed, only about 6.4 are driving significant engagement.
Find the patterns to attract more customers to use your product features.

- Support Patterns: Over time, the nature of their support tickets evolves—from "How do I..." to "Can we...," from basic setups to optimization, and from single teams to multiple departments.
- Expansion Signals: Strong expansion signals include team growth annually, adoption across multiple departments, regular strategy calls, and alignment with your product roadmap.
By mapping these success trends, you can fine-tune your Ideal customer profile further.
3. Research and Validate
No ICP is complete without understanding who isn’t a fit. This stage is about research and validation, where you analyze churned customers and failed implementations. By spotting negative patterns like unclear budget owners, prolonged “just exploring” cycles, or missing technical requirements, you can create an Anti-ICP. This ensures your team avoids customers likely to churn, while validating that your ICP points you toward accounts with lasting success.
Equally important is analyzing churned customers and failed implementations. In SaaS, the average churn rate is around 5%, and a “good” churn rate is considered 3% or less. Here are some key red flags to watch for:
- No clear budget owner
- Prolonged "just exploring" stages (2+ quarters)
- Missing technical requirements
- Gaps in the implementation team
- Undefined success metrics
To mitigate these issues, create an "Anti-ICP" profile. Remember, understanding who you shouldn’t target is as valuable as knowing your ideal customer base.
Read this→ Churn Prevention: 5 Strategies to Stop Customers from Leaving
Data-Driven ICP Refinement Process
A SaaS founder told me, "We know our ICP, but our teams keep bringing in the wrong customers." Sound familiar? Let's fix that with a practical scoring system and cross-functional alignment strategy.
Defining an B2B SaaS ICP isn’t a one-time project — it’s an ongoing process of refinement and application. The final step is operationalizing your ICP through qualification frameworks and scoring systems that guide marketing, sales, and customer success. This means setting must-have criteria, spotting strong positive indicators, identifying caution flags, and disqualifying poor-fit prospects early. Done right, your ICP becomes a living framework that drives alignment across teams and ensures you consistently attract and retain best-fit customers.
Clear Qualification Criteria
"The difference between a good customer and a great customer is rarely luck – it's strategic qualification." - Jason Lemkin, SaaStr Founder Your qualification framework needs to be simple enough for everyone to understand, yet sophisticated enough to catch nuances. Here's how to build it: Create a scoring rubric with these components:
1. Must-Have Characteristics (Deal Breakers)
Think of these as your non-negotiables. Your checklist should include:
- Budget authority for a 12-month commitment
- Technical infrastructure compatible with core features
- Clear success metrics defined before purchase
- Designated implementation owner
2. Strong Positive Indicators
Look for companies that:
- Implemented similar solutions successfully before
- Have a dedicated optimization team
- Show high digital maturity scores
- Maintain active user growth above 20%
3. Caution Flags
These aren't deal-breakers but warrant deeper investigation:
- Multiple stakeholder changes during the sales process
- Urgency without clear ROI calculations
- Complex approval chains for basic decisions
- History of stopping/starting similar projects
4. Automatic Disqualifiers
Immediately disqualify when:
- Technical requirements exceed your roadmap by 6+ months
- The budget requires multiple fiscal year approvals
- Implementation timeline conflicts with technical resources
- Compliance requirements fall outside your certifications
Cross-Functional Alignment
Remember the founder I mentioned earlier? Their problem wasn't just their ICP – it was also poor cross-team alignment. To make sure everyone is moving in the same direction ensure your Ideal customer profile influences:
1. Product Development Priorities
Your product team should validate every major feature against ICP needs. They now require:
- Quarterly ICP validation sessions
- Feature prioritization based on ICP feedback
- Clear ICP use cases for each release
- Regular feedback loops with top ICP matches
2. Marketing Message and Channel Selection Your marketing shouldn't just attract leads – it should attract the right leads. Focus on:
- Content mapped to ICP pain points
- Channel selection based on ICP behavior
- Message testing with successful customers
- Lead scoring aligned with ICP criteria
3. Sales Qualification Process
Transform your sales process from "Can they buy?" to "Should they buy?" Our Client Vymo used this approach and saw remarkable results:
- Generated 500 Marketing Qualified Leads (MQLs)
- Improved engagement rates across target accounts by 2%
- Effectively targeted 50 high-value accounts in the Indian banking & insurance space.
Their secret? A simple traffic light system:The Traffic Light System is a color-coded method for classifying leads based on how closely they align with your Ideal Customer Profile (ICP). It helps prioritize leads based on their potential to convert, saving time and resources by focusing on the highest-value opportunities. To apply the Traffic Light System, we use a lead scoring model that evaluates each prospect based on how closely they align with our Ideal Customer Profile (ICP). Here’s how it works:Scoring Setup:The lead scoring system is set up within Customer Relationship Management (CRM) software, where you can define specific criteria based on your ICP. This includes factors such as company size, industry, revenue, pain points, and decision-making process. Each lead is assigned points based on how closely they meet these criteria.Scoring Process:Each lead is scored on a scale of 0-100 based on their fit with our ICP. Here's how the scoring translates into the Traffic Light System:
- Green (80%+ match): Leads that match 80% or more of your ICP criteria. These are your ideal customers, with a high likelihood of success, minimal implementation challenges, and significant potential for long-term value. They’re your top priority for outreach and engagement.
- Yellow (60-79% match): Leads that match 60-79% of your ICP. These leads have potential, but they may require further qualification or nurturing before they’re ready to engage fully. They’re worth pursuing but need more attention to ensure they’re a good fit.
- Red (Below 60% match): Leads that match less than 60% of your ICP. These are not a good fit for your solution, and pursuing them can waste valuable time and resources. These leads should be disqualified or deprioritized quickly.
Scoring Criteria:The criteria for scoring each lead are reviewed regularly and adjusted based on market trends and feedback from sales and marketing teams. This ensures the scoring system remains aligned with evolving business needs and customer expectations.And we applied this system when working with Vymo.At Vymo, we use this Traffic Light System to efficiently prioritize our leads. We applied this approach to 50 high-value accounts in the Indian banking and insurance space, focusing on Greenlight prospects that matched over 80% of our ICP. This allowed us to engage with accounts that were a perfect strategic fit, significantly reducing the time spent on nurturing less qualified leads.This method not only ensures you're targeting the right customers but also helps you allocate resources more effectively, ultimately improving sales efficiency and growth.Read more→ How to do lead nurturing for SaaS with a scoring method
4. Customer Success Onboarding
Your onboarding should reflect how your best customers implement. An ICP-aligned onboarding reduces time-to-value for SaaS companies. So build your process around:
- Success patterns from top customers
- Common obstacle prevention
- Milestone-based progress tracking
- Early warning system for misalignment
4. Account Management Strategy
Direct your growth resources where they'll have the most impact. Create clear guidelines for:
- Resource allocation based on ICP fit
- Expansion opportunity identification
- Quarterly business review structure
- Success story documentation
By aligning every function with your ICP, you turn clarity into action and action into results. Remember, a well-defined ICP isn't just a document—it's the heartbeat of your growth strategy.
How to Measure You're ICP Effectiveness?
Let's talk about measuring what matters. As a SaaS marketer, I've seen that tracking the right metrics can reveal whether your ICP strategy is working or needs adjustment.
1. Sales Efficiency
The sales process tells you immediately if your ICP is accurate. When working with a mid-market SaaS company last year, we discovered their sales team spent twice as long closing deals that didn't match their ICP.Conversion Rate by ICP Fit ScoreYour conversion rates should vary dramatically based on ICP alignment. Companies with strong ICP matches typically see better conversion rates, while poor fits hover really less. Sales Cycle LengthICP-aligned deals move faster. One client found their perfect-fit customers closed in just 31 days, while others dragged beyond 72 days. Each misaligned ICP criteria adds roughly a week to your cycle.Customer Acquisition Cost (CAC)When Vymo realigned their ICP strategy, they saw a massive improvement in lead quality, reducing wasteful spending on poorly aligned prospects and achieving a more efficient cost-to-conversion ratio. This isn’t just about spending less—it’s about spending smarter.An effective ICP isn’t static; it evolves with data. The more you refine it, the clearer your path to sustainable growth becomes.
2. Customer Success Metrics
Success metrics reveal the long-term accuracy of your ICP. They tell you not just who bought, but who succeeded.Time to First ValueSpeed to value is critical. ICP-aligned customers typically achieve their first win within two weeks. Those outside your ICP might take 90 days or never reach full value. Monitor this carefully – it predicts churn better than any other metric.Product Adoption RateYour best-fit customers follow a predictable adoption curve. They should hit 40% feature adoption in week one and reach 80% by month three. Anything slower suggests an ICP mismatch.Net Promoter Score (NPS)NPS becomes meaningful when segmented by ICP fit. Perfect matches consistently score above 65, while poor fits rarely break 10. Use these gaps to refine your targeting.Customer Health ScoreCreate a holistic view using a 100-point system. Weight usage depth (40%), feature adoption (30%), support satisfaction (20%), and payment history (10%). This composite score predicts retention with surprising accuracy.
3. Financial Impact
The ultimate truth lies in financial performance. These metrics reveal whether your ICP strategy translates to business success.
1. Gross Revenue Retention: Retention rates are a strong indicator of alignment. Customers who are a great fit tend to stay longer and deliver consistent value, while poor matches often result in churn and lost revenue over time.
2. Net Revenue Retention: Your ideal customers should grow with your business. When ICP alignment is strong, these customers naturally expand their relationship, contributing to steady, long-term growth. Misaligned customers, however, can shrink your revenue and hurt scalability.Customer Lifetime ValueAligned customers provide lasting value. They tend to generate significantly higher returns compared to their acquisition cost, making them essential for driving sustainable growth. Misaligned customers, on the other hand, often fail to justify the initial investment.CAC Payback PeriodTime to recoup your investment tells a clear story. ICP-matched customers typically pay back their acquisition cost in 6-8 months, while others take 18+ months – if ever.Remember, these metrics work together to tell a complete story. As one successful founder of SilverStream Software David R. Skok said, "When we got serious about measuring ICP fit, we stopped debating who to target and started proving it with data."Review these metrics weekly with your leadership team. When numbers slip, it usually signals ICP drift. Use this dashboard to stay focused and grow efficiently with the right customers.
Common ICP Pitfalls to Avoid
The biggest ICP failures I've seen weren't from lack of data – they were from poor execution. Here are the critical pitfalls you need to avoid.
1. The Over-Restriction Trap
I recently worked with a SaaS company that defined their ICP so narrowly, that they limited their market to just 200 companies. While their conversion rate was high at 40%, their growth flatlined. Your ICP should guide growth, not restrict it. Consider these guardrails:
- Keep your TAM at least 10x your current customer base
- Focus on must-have characteristics vs. nice-to-haves
- Test removing criteria that don't directly impact success metrics
2. The Set-and-Forget Mistake
Markets evolve. Products evolve. Your ICP must evolve too. Our Client SoluteLabs was trapped in a word-of-mouth referral cycle, lacking structured marketing and sales processes. So we helped them establish a good marketing and sales framework, defining a clear, dynamic Ideal Customer Profile, moving beyond random referrals, and creating a structured approach to customer identification. SoluteLabs achieved significant growth in business development and client acquisition, transforming their approach from referral-dependent to strategically driven.
Here’s how you can implement it:
- Schedule quarterly ICP reviews with data
- Track market changes affecting your customers
- Monitor product capabilities vs. ICP needs
- Document why each criterion matters
3. The Inconsistent Execution Problem
"Different teams, different ICPs" – this kills growth faster than any competitor.When different teams operate with misaligned customer profiles, your growth potential crumbles. Imagine sales targeting enterprise clients while marketing chases small businesses – this misalignment becomes a silent killer of your business potential.Create alignment through:
- Centralized ICP documentation
- Automated scoring in your CRM
- Monthly cross-team ICP workshops
- Clear ICP metrics for each department
Make it stick:
- Build ICP scoring into sales qualification
- Include ICP alignment in marketing KPIs
- Train customer success on ICP indicators
- Review ICP fit in pipeline meetings
One of our sales experts said it best: "When everyone plays by the same ICP rules, magic happens."
How to Implement Your ICP Strategy?
1. First 30 Days: Build Your Foundation
Start with a thorough analysis of your customer data. Pull revenue metrics, usage patterns, and success indicators from your top 25 customers and bottom 10 churned accounts.
Week 1-2:Create your initial ICP framework based on the patterns identified. Focus on:
- Revenue metrics above $100K ARR
- Implementation success in under 30 days
- Feature adoption exceeding 70%
- Support tickets primarily for advanced features
Week 3-4:Develop a simple scoring system:
- Must-have criteria (40% weight)
- Growth indicators (30% weight)
- Technical fit (30% weight)
Train your teams on using this framework through the following:
- Role-specific playbooks
- Interactive workshops
- Real customer examples
2. 60-90 Days: Operationalize Your ICP
Month 2:Configure your CRM with custom fields for ICP scoring. One client saw 50% faster qualification after adding:
- Automated ICP scoring
- Deal routing based on fit
- Red flag alerts
Align your marketing:
- Adjust targeting parameters
- Update content themes
- Revise lead scoring
Refine your sales process:
- Create ICP-specific qualifying questions
- Develop objection-handling guides
- Set up weekly ICP review sessions
3. 90+ Days: Optimize and Scale
Track these metrics religiously:
- Conversion rates by ICP score
- Implementation success rates
- Customer lifetime value
- Net revenue retention
Gather feedback through:
- Monthly team surveys
- Customer interviews
- Lost deal analysis
- Success story documentation
Iterate based on data:
- Quarterly ICP reviews
- Criteria refinements
- Process adjustments
- Team training updates
We helped Vymo transform their sales performance by implementing a structured ICP strategy. Starting with a deep analysis of customer data from Hubspot, we identified key success patterns and created a tailored ICP framework focused on revenue metrics, feature adoption, and technical fit in 30 days. By automating lead qualification and aligning sales and marketing processes, Vymo saw faster growth:
- Increased MQL to SQL conversion from 4.5% to 18% in just 3 months
- Generated a marketing-sourced pipeline worth $41.5 million
- Improved lead management efficiency by 5X
Final Thoughts
Through my work with top SaaS companies, I've seen ICP strategies double growth rates when executed properly. But success requires more than just defining your Ideal customer profile. You need:
- Company-wide commitment to ideal customer standards
- Data-driven decision making
- Regular refinement based on results
- Cross-functional alignment
Start small, but start today. Begin with analyzing your best customers. Look for patterns in their success. Build your framework step by step.Perfect customers aren't born – they're identified, nurtured, and grown. Your ICP will evolve as your product and market mature.The companies that win in SaaS aren't those with the biggest budgets or best features. They're the ones who know exactly who they serve and why.Want help in figuring out your ICP? Book a free call and let me help you find your target customers who stay, pay, and refer.
FAQs
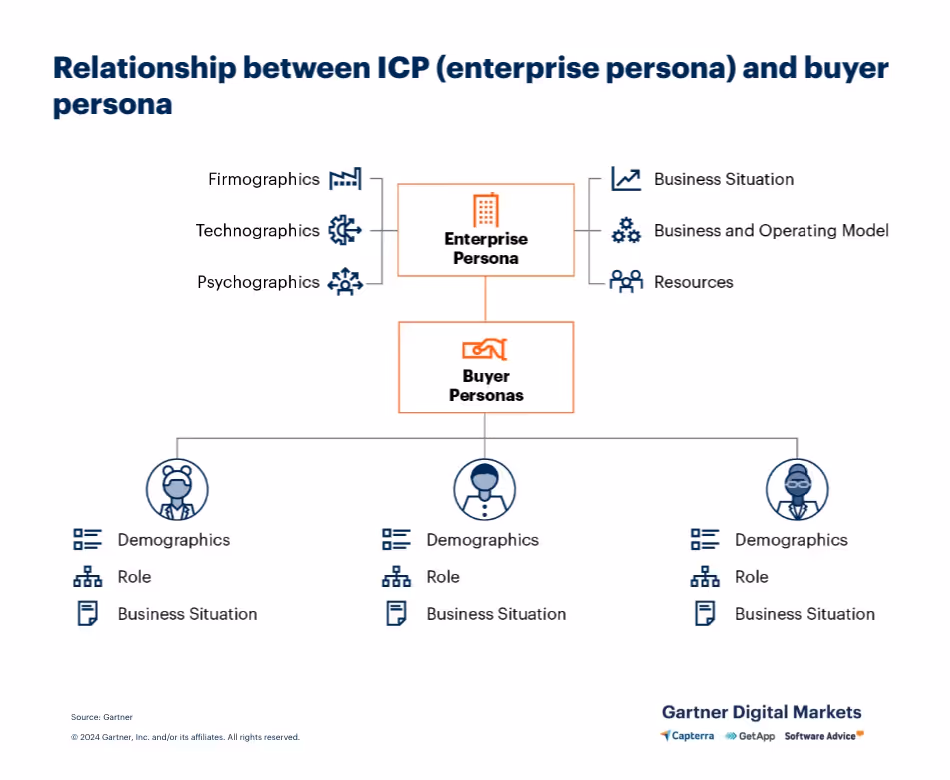
1. What is the difference between ICP and buyer persona?The Ideal Customer Profile (ICP) defines the characteristics of a company that would benefit most from your product or service, focusing on the company level (e.g., size, industry). A buyer persona represents a detailed, semi-fictional profile of an individual buyer within that company, focusing on their goals, challenges, as well as decision-making behavior.2. Give an example of an ideal customer profile.An example of an ICP could be a mid-sized SaaS company with $10M-$50M in annual revenue operating in the financial services industry, with a focus on automating workflows and needing a solution that integrates with third-party analytics tools.If you are wondering how to do it, let a marketing automation agency help you out.3. What fields must an ideal customer profile template contain?An ideal ICP template should include fields like industry, company size, annual revenue, geography, technology stack, pain points, and buying behaviors. These help define the characteristics of companies that are most likely to benefit from your product or service.

.svg)


.webp)