Introduction
No matter where you are in your SaaS journey, there are always fresh opportunities to improve your lead generation efforts. Recent research indicates that public SaaS companies are experiencing an impressive 25% year-over-year growth, reflecting the market’s rapid expansion.
This growth comes with increased customer competition, emphasizing the need for effective lead-generation strategies. Capitalizing on these opportunities is crucial, as acquiring new customers at a low cost is key to sustaining business growth.
So, where do you start? Often, the most straightforward ideas deliver the best results, and that’s where we come in.
What are SaaS leading indicators?
Are you curious about SaaS leading indicators? In the context of SaaS (Software as a Service), leading indicators are observable variables that provide early signs of future performance and can forecast long-term outcomes. These indicators are essential for understanding customer behavior, predicting business health, and guiding strategic decisions.
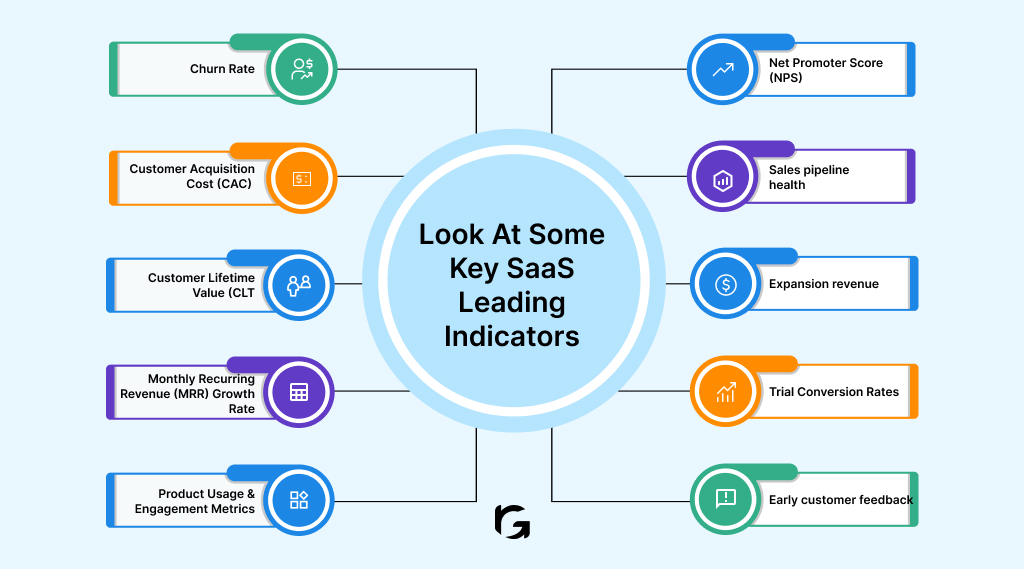
Here’s a detailed look at some key SaaS leading indicators:
- Churn rate
- Customer Acquisition Cost (CAC)
- Customer Lifetime Value (CLT
- Monthly Recurring Revenue (MRR) growth rate
- Product usage and engagement metrics
- Net Promoter Score (NPS)
- Sales pipeline health
- Expansion revenue
- Trial conversion rates
- Early customer feedback
1. Churn rate
The churn rate indicates the percentage of customers who stop using your service within a specific period. It serves as a critical indicator of customer satisfaction and product-market fit. A rising churn rate signals potential issues that require immediate attention, such as product usability or customer support challenges.
2. Customer Acquisition Cost (CAC)
CAC measures the cost of acquiring a new customer, encompassing all marketing and sales expenses. Monitoring CAC is crucial for assessing the efficiency of your customer acquisition strategies. A high or increasing CAC may indicate optimizing marketing campaigns or refining your target audience to improve acquisition costs.
3. Customer Lifetime Value (CLTV)
CLTV predicts a customer’s total revenue throughout their relationship with your business. A healthy CLTV relative to CAC suggests strong profitability and customer retention. It underscores the importance of nurturing long-term customer relationships and continuously delivering value to maintain loyalty.
4. Monthly Recurring Revenue (MRR) growth rate
MRR growth rate measures the monthly increase in revenue from subscription-based services. It is a key indicator of your business’s scalability and market demand. Accelerating MRR growth often indicates effective sales and marketing strategies and a growing customer base.
5. Product usage and engagement metrics
These metrics, such as daily or monthly active users and feature adoption rates, gauge how actively customers use and engage with your product. High engagement levels typically correlate with lower churn rates and higher customer satisfaction. They provide insights into user behavior and feature preferences, guiding product development efforts.
6. Net Promoter Score (NPS)
NPS measures customer satisfaction and loyalty by asking how likely customers are to recommend your product or service to others. It’s a valuable indicator of overall customer sentiment and can influence future growth through positive word-of-mouth referrals and repeat business.
7. Sales pipeline health
This metric assesses the volume and quality of leads, conversion rates, and average deal size within your sales pipeline. A healthy pipeline indicates strong future revenue potential and effective sales processes. Monitoring pipeline metrics helps identify areas for improvement and ensures a steady flow of qualified leads.
8. Expansion revenue
Expansion revenue tracks additional sales from existing customers through upgrades, add-ons, or expansions. It highlights your product’s value proposition and customer satisfaction levels, as satisfied customers are more likely to invest further in your offerings.
9. Trial conversion rates
The trial conversion rate measures the percentage of trial users who convert into paying customers. It reflects the effectiveness of your product trial experience and customer onboarding process. Optimizing trial conversion rates involves refining product positioning, demonstrating value during the trial period, and addressing barriers to conversion promptly.
10. Early customer feedback
Insights from early adopters or initial users provide valuable feedback on product usability, performance, and feature satisfaction. Early feedback helps identify potential issues early on and informs iterative improvements to enhance overall customer experience and satisfaction.
Importance of a SaaS lead indicator in 2024
As SaaS businesses evolve, understanding and using lead indicators become increasingly important. These indicators serve as early warning systems, offering predictions about future performance and guiding strategic decisions:
- Spotting market shifts early
- Making quick, data-driven moves
- Keeping customers happy and loyal
- Perfecting your product-market fit
- Smart use of resources
1. Spotting market shifts early
Lead indicators like how engaged your users are, how they’re using your product, and what they’re saying about it can clue you into changes in the market. Paying attention to these signs allows you to tweak your strategies quickly, staying ahead of the curve and your competitors.
2. Making quick, data-driven moves
Lead indicators give you the data you need to act quickly. Whether you adjust your product features, prices, or marketing, these indicators keep you on target with customers’ needs.
3. Keeping customers happy and loyal
It’s cheaper to keep a customer than to find a new one. Lead indicators like customer satisfaction scores and churn rates tell you how happy your customers are and whether they’re sticking around. You build solid, long-term relationships by identifying issues early and improving their experience.
4. Perfecting your product-market fit
SaaS is about hitting the sweet spot where your product perfectly meets your customers’ needs. Lead indicators show you how well you’re doing that. Metrics like how many trial users become paying customers and how smooth their onboarding experience is to give you insights into what’s working and what needs tweaking.
5. Smart use of resources
Knowing where to put your time and money is crucial. Lead indicators help you see which areas of your business need more attention. Whether investing in new features, ramping up your marketing efforts, or boosting your customer support, using lead indicators ensures you’re putting your resources where they’ll have the most impact.
Lead indicators vs lag indicators: Key differences
| Aspect | Lead Indicators | Lag Indicators | |
| Definition | Predictive metrics that indicate future performance and help forecast outcomes. | Outcome metrics that measure the results of actions already taken. | |
| Purpose | To anticipate future trends and enable proactive decision-making. | To evaluate past performance and assess the effectiveness of strategies. | |
| Usage | Used for planning and optimization to influence future outcomes. | Used for assessment and reflection on what has been achieved. | |
| Timeliness | Forward-looking: provides real-time data to act upon before the outcomes. | Backward-looking; provides data after the fact, reflecting results. | |
| Typically measured more frequently (daily, weekly) | Usually measured less frequently (monthly, quarterly) | |
| Highly actionable; you can influence them now | Less actionable; they show results of past actions |
Understanding the differences between these indicators can help SaaS companies balance their focus between what’s coming next and what has already happened, enabling them to steer their strategies more effectively.
Conclusion
This article has explored the key indicators crucial for SaaS success. It’s clear that succeeding in this competitive industry requires more than just collecting data; it’s about taking smart actions.
However, knowing these metrics is just the start; the real challenge is using them effectively to grow your business. Each indicator is like a puzzle piece, giving you a complete picture of how your business is doing and where it can go.
At Revv Growth, we specialize in helping SaaS companies navigate these complexities. Our experts can ensure your strategy aligns with current trends and prepares you for future shifts.
Let’s work together to turn insights into actionable plans that drive steady growth and keep your business ahead in this fast-paced industry.
FAQs
1. How can user engagement levels serve as a lead indicator?
– High user engagement suggests that customers find the product valuable and are more likely to convert to paying customers or renew their subscriptions.
2. Why is the sales pipeline value considered a lead indicator?
– The value of deals in the sales pipeline indicates potential future revenue, helping businesses forecast financial performance and allocate resources effectively.
3. How can SaaS businesses track and measure lead indicators effectively?
– Businesses can use analytics tools, CRM systems, and marketing automation platforms to track and measure lead indicators, ensuring they collect accurate and actionable data.
4. How can SaaS businesses leverage early customer feedback as a lead indicator?
– Early customer feedback provides actionable insights into product usability and feature satisfaction, allowing businesses to improve quickly. This proactive approach enhances the overall customer experience and reduces churn rates.
5. Why is tracking trial conversion rates crucial for SaaS businesses?
– Monitoring trial conversion rates reveals the effectiveness of the onboarding process and product trial experience. High conversion rates indicate successful transitions from trial to paid users, highlighting strong product-market fit and customer value perception.