Introduction
Every marketing strategy carries its own set of challenges. A few months ago, I discovered that simply investing in demand generation wasn’t enough; it required clear, measurable indicators to steer my campaigns. That insight led me to focus on 11 critical metrics that reveal where efforts succeed and where adjustments are needed. Metrics like lead quality, conversion rates, and pipeline growth now serve as my compass for driving real results.
In this guide, I break down each metric to help fine-tune your campaigns and achieve your revenue goals in 2025. You’ll gain insights into how customer acquisition cost, ROI, and other key indicators work together to inform your strategy. Let’s uncover these essential measurements and see how they can boost your marketing performance.
What is the difference between demand generation and lead generation?
Let’s learn about the difference between demand generation and lead generation:
| Aspects | Demand Generation | Lead Generation |
| Purpose | To create awareness and interest in a brand or product, expanding its reach to potential customers. | To identify and capture individuals who are interested in the product or service, turning them into potential customers. |
| Target Audience | Broad audience: Anyone who may be interested in the brand or product. | Narrow audience: Individuals who have shown specific interest or intent to buy. |
| Marketing Strategies | Involves content marketing, brand campaigns, social media engagement, and educational resources to build interest. | Uses gated content, email campaigns, and forms to capture leads and move them into the sales funnel. |
| Timeline | Long term: Focuses on building a steady flow of interest and demand over time. | Short term: Aims to capture leads for immediate follow-up and conversions quickly. |
| Measurement | Metrics include website traffic, social media engagement, brand mentions, and content views. | Metrics include the number of leads captured, conversion rates, cost per lead, and lead quality. |
| Sales Funnel Stage | Top of the funnel: Generates interest and awareness, guiding individuals into the sales pipeline. | Middle of the funnel: Captures leads and helps move them through the pipeline toward conversion. |
| Role in Sales Process | Prepares the market and builds awareness, creating a foundation for lead generation activities. | Focuses on turning potential customers into actual customers through nurturing and client engagement. |
| Budget | Requires investment in brand-building activities and strategies, sometimes larger up-front costs. | Requires investment in tools and tactics that directly capture and convert leads, potentially lower up-front costs. |
| Outcome | Builds brand recognition and positions the company as an industry leader, generating long-term interest. | Provides a pool of potential customers, ready to be nurtured and converted into sales. |
11 SaaS Demand generation metrics to measure in 2025
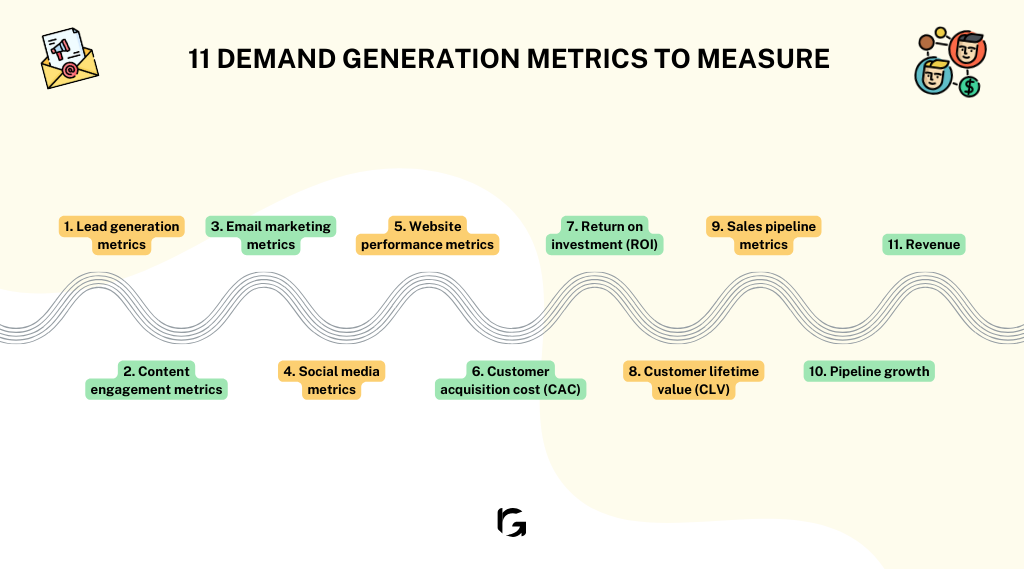
- Lead generation metrics
- Content engagement metrics
- Email marketing metrics
- Social media metrics
- Website performance metrics
- Customer acquisition cost (CAC)
- Return on investment (ROI)
- Customer lifetime value (CLV)
- Sales pipeline metrics
- Pipeline growth
- Revenue
Measuring demand generation metrics allows businesses to optimize marketing strategies, improve resource allocation, and increase ROI. It also enables a deeper understanding of customer engagement and behavior, guiding targeted efforts for better conversion rates.
Ultimately, this measurement fosters data-driven decisions, enhancing overall marketing performance and driving sustainable revenue growth.
So, let’s understand the eleven essential demand generation metrics in detail:
1. Lead generation metrics
Lead generation is the process of attracting and converting visitors into leads, essentially individuals or organizations that have expressed interest in your product or service.
Lead volume: This metric represents the total count of new leads generated over a specific timeframe, which is crucial for understanding the scale of potential business opportunities created by your marketing efforts. High lead volume indicates successful top-of-funnel activities but must be balanced with quality to ensure efficiency in the sales process.
Lead quality and scoring: Not all leads have the same potential to convert into paying customers. Lead quality and scoring involve evaluating each lead based on specific criteria (such as demographic information, interaction with your content, and behavior on your website) to prioritize them for sales engagement. This process helps focus efforts on leads most likely to convert, improving efficiency and conversion rates
Conversion rate: Conversion rate measures the percentage of leads that complete a desired action, such as purchasing or signing up for a trial. This metric is vital for assessing the effectiveness of your lead nurturing and sales strategies. A higher conversion rate indicates that your marketing and sales efforts are well-aligned with your target audience’s needs and expectations.
2. Content engagement metrics
Content engagement measures how interactively audiences engage with your content, reflecting its relevance and value. Key metrics to track are page views, unique visits, time on page/session duration, and content downloads.
- Page views and unique visits: These metrics offer insights into the reach and attractiveness of your content. Page views show how often content is accessed, while unique visits reveal the number of distinct individuals who have viewed your content. These metrics help gauge the breadth of your content’s appeal and its ability to attract a diverse audience.
- Time on page/session duration: This indicates how long visitors stay engaged with your content. Longer durations suggest that your content is relevant and engaging to your audience, which is a positive signal to search engines and can improve your SEO rankings.
- Content downloads: The number of times your resources (like e-books, whitepapers, and guides) are downloaded reflects the interest and engagement of your audience with your content. High download rates signal strong lead generation potential from your content marketing efforts.
3. Email marketing metrics
Email marketing metrics assess the effectiveness of email campaigns in engaging recipients and driving desired actions. Open rate, click-through rate (CTR), and unsubscribe rate are essential metrics.
- Open rate: This metric indicates the percentage of email recipients who open an email you send. It’s a direct measure of how compelling your email subject lines are and can reflect the overall health of your email list.
- Click-through rate (CTR): CTR measures the effectiveness of your email content by tracking the percentage of recipients who click on at least one link within the email. It helps assess how engaging your message is and whether it prompts action.
- Unsubscribe rate: The rate recipients unsubscribe from your email list following an email campaign. While some attrition is normal, a high unsubscribe rate may indicate email frequency, relevance, or quality issues.
4. Social media metrics
Social media metrics evaluate the impact of your social media strategies on audience growth and engagement. Essential factors to track are:
- Engagement rate: This encompasses likes, comments, shares, and other interactions on your social media posts. High engagement rates indicate content that resonates with your audience, fostering community and amplifying your brand’s reach.
- Followers growth rate: The rate at which your social media following increases. This metric reflects the effectiveness of your social media strategy in building your brand’s presence and attracting new audience members.
- Social media conversion rate: This measures how effectively your social media activities lead to desired actions, such as website visits, sign-ups, or purchases. Understanding the ROI of your social media marketing efforts is crucial.
5. Website performance metrics
Website performance metrics provide insights into your website’s effectiveness in attracting and retaining visitors. It is important to monitor traffic by source, bounce rate, and SEO rankings for key keywords.
- Traffic by source: Analyzing traffic sources helps you understand which marketing channels (organic search, social media, paid ads) are most effective at driving visitors to your website. This insight is key to allocating your marketing budget and efforts more efficiently.
- Bounce rate: The percentage of visitors who leave your website after viewing only one page. A high bounce rate can indicate that your landing pages are irrelevant or engaging enough to encourage further site exploration.
- SEO rankings for key keywords: Your visibility in search engine results for important keywords related to your business. High rankings can drive significant organic traffic to your website, reducing reliance on paid advertising.
6. Customer acquisition cost (CAC)
CAC measures the total average cost of acquiring a new customer, considering all marketing and sales expenses.
It’s crucial to understand the efficiency of your marketing strategies and ensure that the value of a customer exceeds the cost of acquiring them.
7. Return on investment (ROI)
ROI calculates the profitability of your marketing investments. A positive ROI means your marketing strategies generate more revenue than the cost incurred, indicating successful demand generation efforts.
8. Customer lifetime value (CLV)
CLV predicts the total revenue a business can expect from a single customer account throughout their relationship.
It helps businesses understand the long-term value of investing in customer relationships and balancing acquisition costs.
9. Sales pipeline metrics
Sales pipeline metrics track the efficiency and effectiveness of your sales process, including pipeline velocity and win rate, which indicate sales process efficiency and lead quality.
- Pipeline velocity: This measures how quickly leads move through your sales pipeline to become customers. Faster velocities indicate efficient sales processes and effective demand generation strategies.
- Win rate: The ratio of deals won to the total number of deals. It reflects the effectiveness of your sales team and the quality of leads generated by your marketing efforts.
10. Pipeline growth
Pipeline growth refers to expanding the number of potential deals or leads within a business’s sales process.
It is a measure of both the effectiveness of a company’s marketing efforts in generating new leads and the ability of the sales team to progress these leads through the sales funnel.
A growing pipeline indicates a healthy influx of potential business and is a positive sign of future revenue growth. It also reflects the scalability of a company’s sales and marketing strategies, highlighting areas of success and opportunities for optimization.
11. Revenue
Revenue metrics directly measure the financial impact of marketing and sales activities. Key metrics include revenue generated, revenue by channel, revenue growth rate, average revenue per customer (ARPC), and revenue retention rate.
- Revenue generated: The total income from demand generation efforts indicates the direct financial impact of marketing and sales activities. Measuring the success of these strategies on your bottom line is essential.
- Revenue by channel: Analyzes income from different marketing channels, helping identify the most profitable sources of customer acquisition.
- Revenue growth rate: Tracks the speed at which revenue increases, offering insights into business health and the effectiveness of demand generation over time.
- Average revenue per customer (ARPC): Measures the average income each customer contributes, which is useful for assessing customer value and targeting strategies.
- Revenue retention rate: For subscription-based models measure how much revenue from existing customers is maintained, highlighting customer retention success.
FAQs
1. How do you measure demand gen?
By tracking metrics such as lead volume, conversion rates, customer acquisition cost, content engagement, and revenue growth. These indicators help verify the effectiveness and efficiency of your campaigns.
2. What is demand generation KPIs?
Demand generation KPIs are key performance indicators that quantify campaign success. They include metrics like website traffic, lead quality, conversion rate, customer acquisition cost, and return on investment.
3. What are demand gen techniques?
Techniques include content marketing, account-based marketing, targeted email campaigns, SEO, social media outreach, paid advertising, and webinars. These methods build awareness and nurture prospects through the funnel.
4. Is SEO demand generation?
Yes, SEO is a crucial part of demand generation. It increases organic visibility and attracts high-intent traffic that can be converted into qualified leads.
5. What falls under demand generation?
Demand generation covers activities such as brand awareness campaigns, content creation, social media engagement, paid advertising, and educational events that build interest and move prospects toward conversion.
Wrapping up.
By measuring demand generation metrics, you can align marketing efforts with tangible results and ensure you’re making a real impact instead of just making noise.
Not tracking demand generation metrics risks inefficient resource allocation, missed opportunities for optimization, and an inability to gauge the effectiveness of marketing strategies.
This lack of insight can lead to wasted resources, decreased competitiveness, and a failure to meet revenue targets. Neglecting these metrics may hinder business growth and limit the ability to adapt to changing market conditions.
Will you ignore crucial insights, or will you track these metrics in 2024? Take control and make data-driven decisions for better marketing, satisfied customers, and increased revenue. Talk our demand generation experts today.